
Does The Graph Show A Proportional Relationship
Ever looked at a graph and wondered if there’s a perfect, predictable pattern going on? You know, where if one thing goes up, the other goes up by a consistent amount? That’s exactly what we’re diving into today with the fun and incredibly useful concept of a proportional relationship. It's like a secret code that helps us understand how things are connected, and once you spot it, you'll start seeing it everywhere!
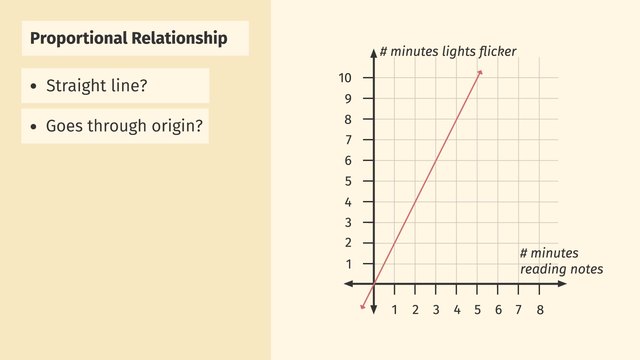
So, what exactly is a proportional relationship? In simple terms, it means that two quantities are directly linked. If you double one, you automatically double the other. If you triple one, you triple the other, and so on. The key is that this relationship stays consistent. On a graph, this looks like a straight line that passes right through the origin (the point where the x and y axes meet, also known as zero). Think of it as a perfectly balanced seesaw – if one side goes up a little, the other side goes up by the exact same proportional amount.
Why is this cool? For beginners, understanding proportional relationships is a fantastic first step into the world of math and data. It’s like learning your ABCs before writing a story. For families, it’s a great way to make everyday activities more engaging. Imagine calculating how much paint you’ll need for a project based on the size of the area – that's likely a proportional relationship! Hobbyists, whether they're into gardening, cooking, or even model building, can use this concept to scale recipes, estimate material needs, or understand growth rates. It’s about making informed decisions based on clear patterns.
Let's look at some examples. If you're buying apples at $2 per pound, the total cost is directly proportional to the number of pounds you buy. Buy 1 pound, it’s $2. Buy 2 pounds, it’s $4. Buy 3 pounds, it’s $6. That’s a straight line on a graph with "pounds" on one axis and "cost" on the other, hitting the origin. Another common example is distance traveled at a constant speed. If you drive at 50 miles per hour, the distance you cover is proportional to the time you spend driving.

Variations might show up when a relationship is close to proportional but not perfectly. You might see a line that’s almost straight and passes near the origin. Or, you could have a relationship that’s linear but doesn't pass through the origin, meaning there’s a starting value or an offset. These are still useful, but they aren’t strictly proportional.
Getting started is easier than you think! Next time you see a graph, whether in a book, online, or even on a product package, ask yourself:
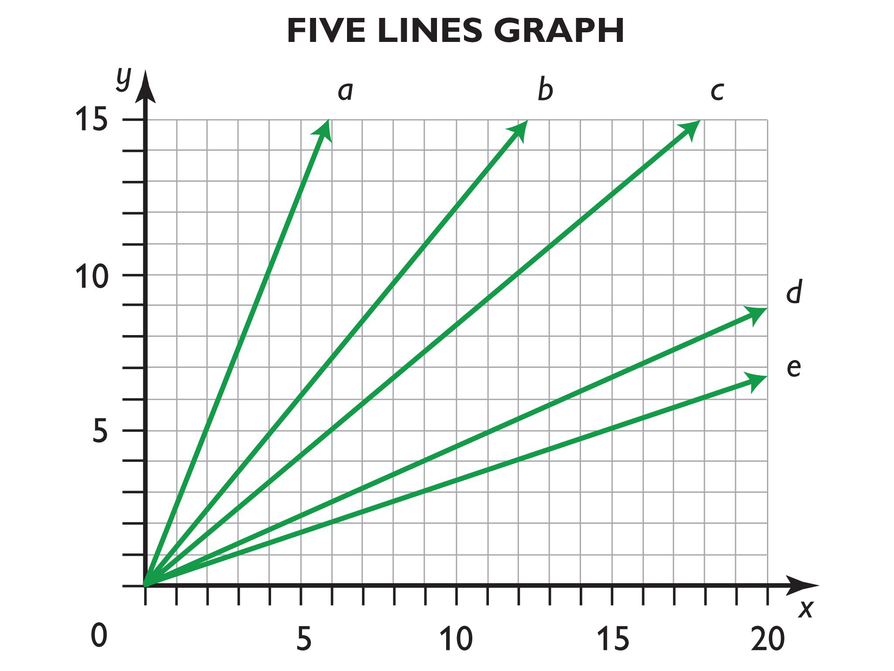
- Does it look like a straight line?
- Does that line go through the origin (0,0)?
- If I double one value, does the other value also double?
You can even try creating your own simple graphs! Pick a scenario, like saving money. If you save $10 each week, plot how much you save over 1, 2, 3 weeks. You’ll see that perfect, proportional line emerge!
Discovering proportional relationships in graphs is a rewarding experience. It’s not just about numbers; it’s about recognizing order and predictability in the world around us, making everyday problem-solving a little more intuitive and a lot more fun!