
How To Solve A Two Way Table
Okay, so picture this: It was a gloomy Tuesday, the kind where the sky looks like it’s wearing a grey, fuzzy sweater. I was staring at my laptop, drowning in a sea of numbers. My friend, Sarah, a spreadsheet wizard, sauntered over, a smug grin on her face. "Stuck?" she asked, leaning in. I groaned, pointing at my screen. "This two-way table… it's like a cryptic crossword designed by aliens. I just can't figure out what these numbers mean!" Sarah, bless her numerical heart, just chuckled and said, "It's not rocket science, you know. It's just about connecting the dots." And then she proceeded to untangle the whole mess in about five minutes, leaving me feeling both enlightened and slightly embarrassed.
That, my friends, is pretty much how I feel about tackling a two-way table. Sometimes, they look intimidating. A grid of cells filled with figures, seemingly disconnected and confusing. But Sarah was right. It’s all about connecting the dots, understanding the relationships between different pieces of information.
So, What Exactly IS a Two-Way Table?
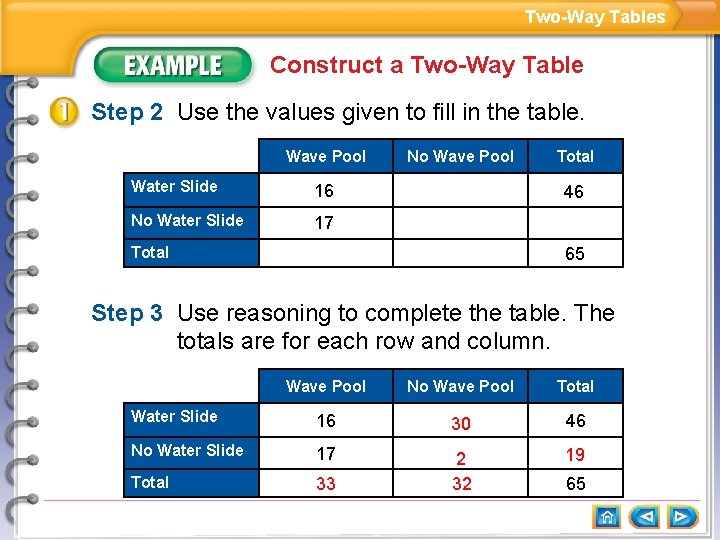
Before we dive into the 'how-to,' let's quickly define our adversary. A two-way table, also known as a contingency table, is basically a way to display the relationship between two categorical variables. Think of it as a snapshot of how one thing is distributed across different categories of another thing. For instance, you might have a table showing the number of students who like or dislike a certain subject, broken down by whether they are male or female.
It’s called 'two-way' because you’re looking at two dimensions of data. You’ve got your rows and your columns, each representing a different category. Pretty straightforward, right? (Don't worry, I’ll remind you of this when it starts feeling complicated again.)
The Grand Unveiling: Your First Two-Way Table
Let's imagine we're running a small, very important survey. We're interested in two things: the preferred ice cream flavor (vanilla or chocolate) and whether people prefer to eat it in a cone or a cup. Sounds crucial, I know. Let’s pretend we surveyed 100 people.
Here’s what our data might look like initially:
Out of 100 people:
- 60 people like vanilla.
- 40 people like chocolate.
- 50 people prefer cones.
- 50 people prefer cups.
- 35 people like vanilla AND prefer cones.
Now, if you just looked at those individual bullet points, you might be a bit lost. How many people like chocolate and prefer cups? We haven't been told that directly. This is where our trusty two-way table swoops in to save the day!
Building the Foundation: The Empty Grid
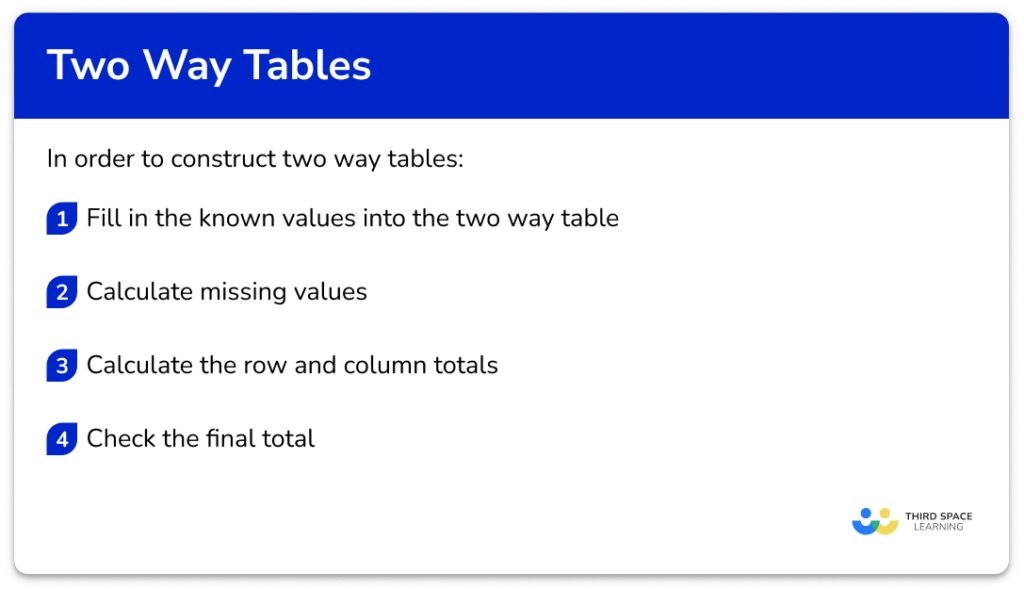
The first step to solving any two-way table is to set up the structure. You need a grid with your categories for rows and your categories for columns. You’ll also need space for totals!
In our ice cream example, our categories are:
- Row Categories: Ice Cream Flavor (Vanilla, Chocolate)
- Column Categories: Serving Method (Cone, Cup)
So, let’s draw it out. It usually looks something like this:
| Cone | Cup | Total | |
|---|---|---|---|
| Vanilla | |||
| Chocolate | |||
| Total |
See? It's just a grid. Nothing scary yet. We’ve got our rows for flavors and our columns for how they’re served. And we’ve added 'Total' rows and columns to keep track of everything.
Filling in the Blanks: The Knowns
Now, let's start populating our table with the information we do have. These are our starting points, our solid facts.

From our survey:
- Total people surveyed: 100
- Total vanilla lovers: 60
- Total chocolate lovers: 40
- Total cone lovers: 50
- Total cup lovers: 50
- Vanilla lovers who prefer cones: 35
Let's put these directly into our table. Remember, the 'Total' cells are for the sums of their respective rows or columns.
| Cone | Cup | Total | |
|---|---|---|---|
| Vanilla | 35 | 60 | |
| Chocolate | 40 | ||
| Total | 50 | 50 | 100 |
Look at that! Already looks a bit more organized. Notice how the bottom-right cell, the grand total, is filled in. That’s often your anchor point. All your totals should add up to this grand total.
The Art of Deduction: Finding the Unknowns
This is where the magic happens, where we become data detectives. We use the information we have to figure out the missing pieces. It’s all about subtraction and addition, folks!
Let's start with the Vanilla row. We know 60 people like vanilla, and 35 of them prefer cones. How many vanilla lovers must prefer cups?
Total Vanilla Lovers - Vanilla Lovers Who Prefer Cones = Vanilla Lovers Who Prefer Cups
60 - 35 = 25
So, 25 vanilla lovers prefer cups. Let's pop that into the table:
| Cone | Cup | Total | |
|---|---|---|---|
| Vanilla | 35 | 25 | 60 |
| Chocolate | 40 | ||
| Total | 50 | 50 | 100 |
See how the 'Vanilla' row now adds up: 35 + 25 = 60. Perfect!
Now let's look at the Cone column. We know 50 people prefer cones in total, and 35 of them like vanilla. How many chocolate lovers must prefer cones?

Total Cone Lovers - Vanilla Lovers Who Prefer Cones = Chocolate Lovers Who Prefer Cones
50 - 35 = 15
So, 15 chocolate lovers prefer cones. Add it to the table:
| Cone | Cup | Total | |
|---|---|---|---|
| Vanilla | 35 | 25 | 60 |
| Chocolate | 15 | 40 | |
| Total | 50 | 50 | 100 |
And the 'Cone' column adds up: 35 + 15 = 50. Looking good!
We’re almost there. We just have one cell left: Chocolate lovers who prefer cups. We can find this in two ways now, which is a great way to double-check your work.
Method 1: Using the Chocolate row
Total Chocolate Lovers - Chocolate Lovers Who Prefer Cones = Chocolate Lovers Who Prefer Cups
40 - 15 = 25
Method 2: Using the Cup column
Total Cup Lovers - Vanilla Lovers Who Prefer Cups = Chocolate Lovers Who Prefer Cups
50 - 25 = 25
Voilà! Both methods give us 25. It’s the same number, so we can be pretty confident it's correct. Let’s fill in that last piece:
| Cone | Cup | Total | |
|---|---|---|---|
| Vanilla | 35 | 25 | 60 |
| Chocolate | 15 | 25 | 40 |
| Total | 50 | 50 | 100 |
The Finished Product: What Does It All Mean?
And there you have it! A completed two-way table. It’s no longer a jumble of numbers; it’s a clear, organized summary of our survey data. We can now easily see:
- 35 people like vanilla and prefer cones.
- 25 people like vanilla and prefer cups.
- 15 people like chocolate and prefer cones.
- 25 people like chocolate and prefer cups.
This is so much more insightful than the original list of facts, isn't it? We can immediately answer questions like:
- Which flavor is more popular overall? (Vanilla, with 60 votes)
- Is there a preferred serving method? (It’s a tie, 50 for cones, 50 for cups)
- Are people who like vanilla more likely to prefer cones than people who like chocolate? (Yes, 35 out of 60 vanilla lovers prefer cones, compared to 15 out of 40 chocolate lovers. That's a higher proportion.)
This last point is where two-way tables really shine. They help us spot trends and relationships that might be hidden in raw data.
Tips and Tricks for Two-Way Table Triumph
Okay, let's recap some key strategies that will make you a two-way table ninja:
1. Start with the Totals.
The grand total is your best friend. Always put it in the bottom-right corner. Ensure all your row totals and column totals add up to it. If they don't, something is off!
2. Fill in the 'Knowns' First.
Don't try to guess; start with the data points you're explicitly given. These are your anchor points.
3. Use the Power of Subtraction (and Addition!).
Most of the time, you'll be subtracting to find missing values. For example, to find the number of people in a specific cell, you might subtract a known part from a known total (either from its row or its column).
4. Work Methodically.
Don't jump around randomly. Fill in what you can, then see which missing pieces become solvable. Sometimes, you might need to calculate a value from a row before you can use it to figure out a value in a column, or vice-versa.
5. Always Double-Check!
This is non-negotiable. Once you think you’ve filled in everything, go back and verify. Does each row add up correctly? Does each column add up correctly? Do all the totals add up to the grand total? If you can find a missing piece in two different ways, and you get the same answer, you’re golden.

6. Understand the Question Being Asked.
Sometimes, the task isn't just to fill in the table, but to use the completed table to answer specific questions. Make sure you know what information you need to extract and how to interpret it. For example, to find the proportion of vanilla lovers who prefer cones, you'd divide the number of vanilla-cone lovers (35) by the total number of vanilla lovers (60).
7. Don't Be Afraid to Draw It Out.
If you’re working on paper, sketch out the grid. Cross off numbers as you use them. Make notes. Whatever helps you keep track!
When Things Get a Little Trickier
What if you're not given as many initial numbers? Sometimes, you might only be given marginal totals (the row and column totals) and the grand total. In that case, you'll need to work with variables. Let’s say you're given:
- Total Men: 50
- Total Women: 70
- Total Employed: 80
- Total Unemployed: 40
- Grand Total: 120
And you need to find how many men are employed. You don’t have any direct figures linking gender and employment status. In this situation, you'd typically use algebra. You might set 'x' as the number of employed men. Then, you can express other cells in terms of 'x' and solve for it using the row and column totals. This is a bit more advanced, but the core principle of connecting the dots remains the same.
For example, if 'x' is employed men:
- Employed Women = Total Employed - Employed Men = 80 - x
- Unemployed Men = Total Men - Employed Men = 50 - x
- Unemployed Women = Total Unemployed - Unemployed Men = 40 - (50 - x) = 40 - 50 + x = x - 10
Then you can use the 'Women' row total: Employed Women + Unemployed Women = Total Women
(80 - x) + (x - 10) = 70
70 = 70
Uh oh! This particular set of numbers means we can't uniquely solve for 'x' using just this information. This means that either the numbers are perfectly balanced, or there's missing information. It highlights that sometimes, even with algebraic manipulation, you might not get a single definitive answer if the data doesn't provide enough constraints. Usually, though, a two-way table problem in a typical math context will have enough information to solve.
The key takeaway here is that the fundamental logic of filling in totals and using subtraction remains the same, even when you need a bit of algebra. You’re still looking for those relationships within the grid.
In Conclusion: You've Got This!
So, next time you encounter a two-way table, don’t panic! Remember Sarah’s advice: it’s just about connecting the dots. Set up your grid, fill in your knowns, and use subtraction and addition to carefully deduce the unknowns. Double-check your work, and you'll be solving them like a pro. It's a powerful tool for making sense of data, and once you get the hang of it, you’ll start seeing them everywhere, breaking them down with confidence. Happy data crunching!