Which Graph Shows A Proportional Relationship Between X And Y
Imagine you’re at a charming little bakery, the kind where the scent of cinnamon and sugar hangs in the air like a warm hug. You notice their famous cookie prices are displayed on a little chalkboard. You're curious, wondering if there's a fair way they charge for their delightful creations. This is where a little bit of math magic comes into play, and it’s not as scary as it sounds!
We’re talking about something called a proportional relationship. Think of it like a perfectly balanced seesaw. If one side goes up a little, the other side goes up the exact same amount, proportionally. It’s all about fairness and consistency.
Now, let’s say the bakery charges $2 for one cookie. If you buy two cookies, you’d expect to pay $4, right? And for three cookies, it would be $6. This is the heart of a proportional relationship: for every extra cookie you grab, the price goes up by a predictable amount, and importantly, it always starts from zero. If you bought zero cookies, you’d pay zero dollars. That’s the golden rule!
Sometimes, this relationship is shown with lines on a special kind of drawing called a graph. Think of a graph as a map for numbers. It has two important roads, one going sideways (the x-axis) and one going up and down (the y-axis). We plot points on this map to see how two things are connected.
So, what kind of line on this map screams "proportional relationship"? It’s a straight line that goes right through the origin. The origin is that very important spot where the two roads, the x and y axes, meet. It’s like the starting gate for our cookie adventure.
If you see a line that starts at the origin and goes up in a straight path, congratulations! You’ve found your proportional relationship. It means that as you increase the number of cookies (that’s our ‘x’ value), the total price (our ‘y’ value) increases in a perfectly predictable and honest way.
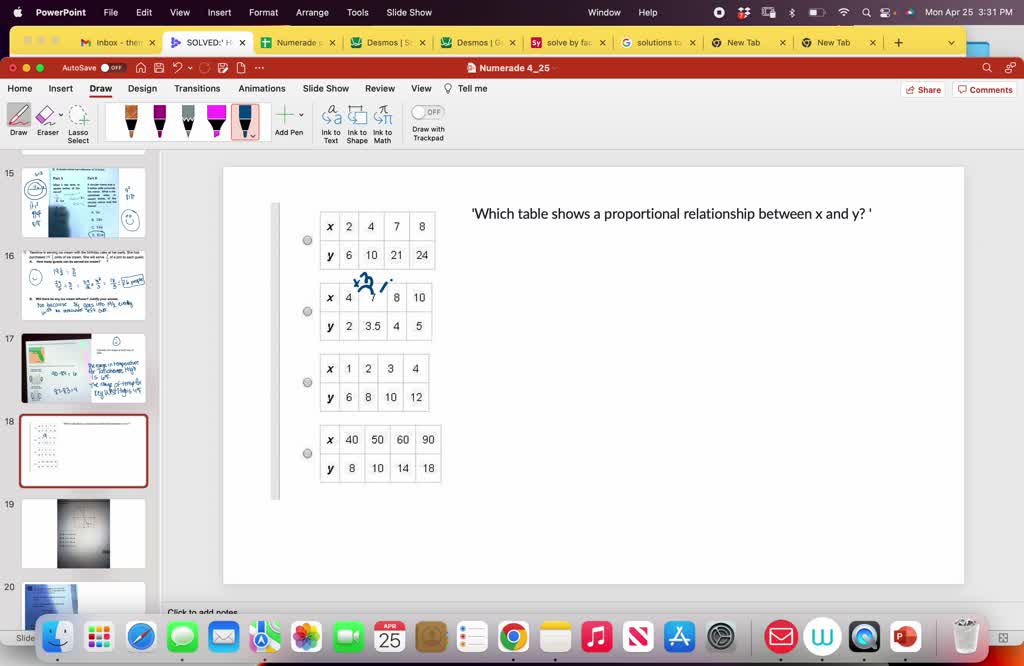
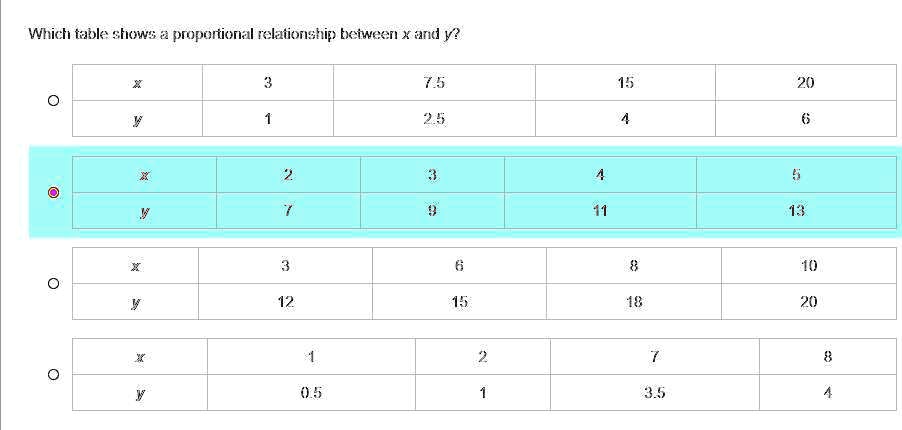
But what if the line doesn't start at the origin? Let’s say our bakery has a “cute cookie tray” fee of $5, regardless of how many cookies you buy. So, one cookie might cost you $7 ($5 tray + $2 cookie), and two cookies would be $9 ($5 tray + $4 cookies).
In this case, if you plot these points on our number map, the line would be straight, but it would start above the origin. It wouldn’t be a proportional relationship. It's still a relationship, but it has an added starting cost, like a cover charge for a secret cookie party!
Another funny thing to watch out for is when the line isn't straight at all. Imagine the bakery decides to offer a “buy 5, get one free” deal. The price per cookie might seem to jump around in a quirky way. One moment it’s one price, the next it’s a different, more surprising price.
When the line on the graph wiggles or curves, it’s not showing a simple, consistent proportional relationship. It’s more like a rollercoaster ride of costs! You might get a great deal sometimes, but it's not a steady, proportional climb.
So, how do you spot the "proportional" graph in the wild? Look for that beautiful, unwavering straight line that bravely sails through the origin. It’s a symbol of fairness, a promise of consistent value, and a testament to the simple beauty of things that grow together in perfect harmony.
Think about how much you love a perfectly brewed cup of tea. If you use one tea bag for one cup, and two tea bags for two cups, that’s a proportional relationship! The number of tea bags is directly and predictably related to the number of cups you can make. No surprises, just cozy comfort.
Or consider how much water your pet goldfish needs. If your goldfish is tiny, it needs a small bowl. If it's a bit bigger, it needs a slightly larger tank. The size of your goldfish (the ‘x’) is directly and proportionally related to the amount of water it needs to swim happily (the ‘y’).
The beauty of a proportional relationship on a graph is its simplicity and predictability. It’s like a well-written song where every note flows perfectly into the next, creating a harmonious melody. There are no jarring surprises, just a smooth, continuous progression.
Let's say you're building with LEGOs. For every two red bricks you use, you might use one blue brick. If you use four red bricks, you'd use two blue bricks. This is a proportional relationship. The number of red bricks dictates the number of blue bricks in a consistent ratio.
When you plot this on a graph, you'll see that straight line starting at the origin. It tells a story of perfect balance, where for every unit you increase on the ‘x’ axis, you increase a corresponding, fixed unit on the ‘y’ axis.
It’s this predictability that makes proportional relationships so useful. They help us understand how things scale. If a recipe calls for one egg for 12 cookies, and you want to make 24 cookies, you know you’ll need two eggs. That’s a proportional leap!
The graph that shows this is like a secret handshake between two numbers. It’s a visual confirmation that as one number grows, the other grows at the same pace, maintaining a constant ratio. It’s a kind of mathematical friendship.
So, next time you see a graph, don't be intimidated. Look for that special straight line. Does it start at the cozy, welcoming origin? If it does, you’ve discovered a proportional relationship. It’s a little piece of mathematical elegance, showing us how things can grow together in a fair and beautiful way, just like those delicious cookies from our favorite bakery.
It's a reminder that even in the world of numbers, there's room for simplicity, honesty, and a touch of charm. It’s the kind of relationship you can count on, one where the price is always right, and the growth is always fair.
The key is that special straight line that passes through the origin. That's your ticket to a proportional paradise!
Think of it as a promise from the numbers: "If you give me a little bit more, I'll give you back the exact proportional amount." No funny business, just pure, straightforward connection.
It’s like a perfectly trained dog that always responds to your command. You give the command (the ‘x’ value), and the dog performs the action (the ‘y’ value) in a consistent, predictable manner. That’s the essence of a proportional relationship – dependable and true.
So, go forth and explore the world of graphs! Your mission, should you choose to accept it, is to find those charming, straight lines that bravely march through the origin. They are the unsung heroes of predictability and fairness in the vast landscape of mathematics.